Closed beta

Nodes, not notes

CultiNode connects the places you measure with the decisions you make

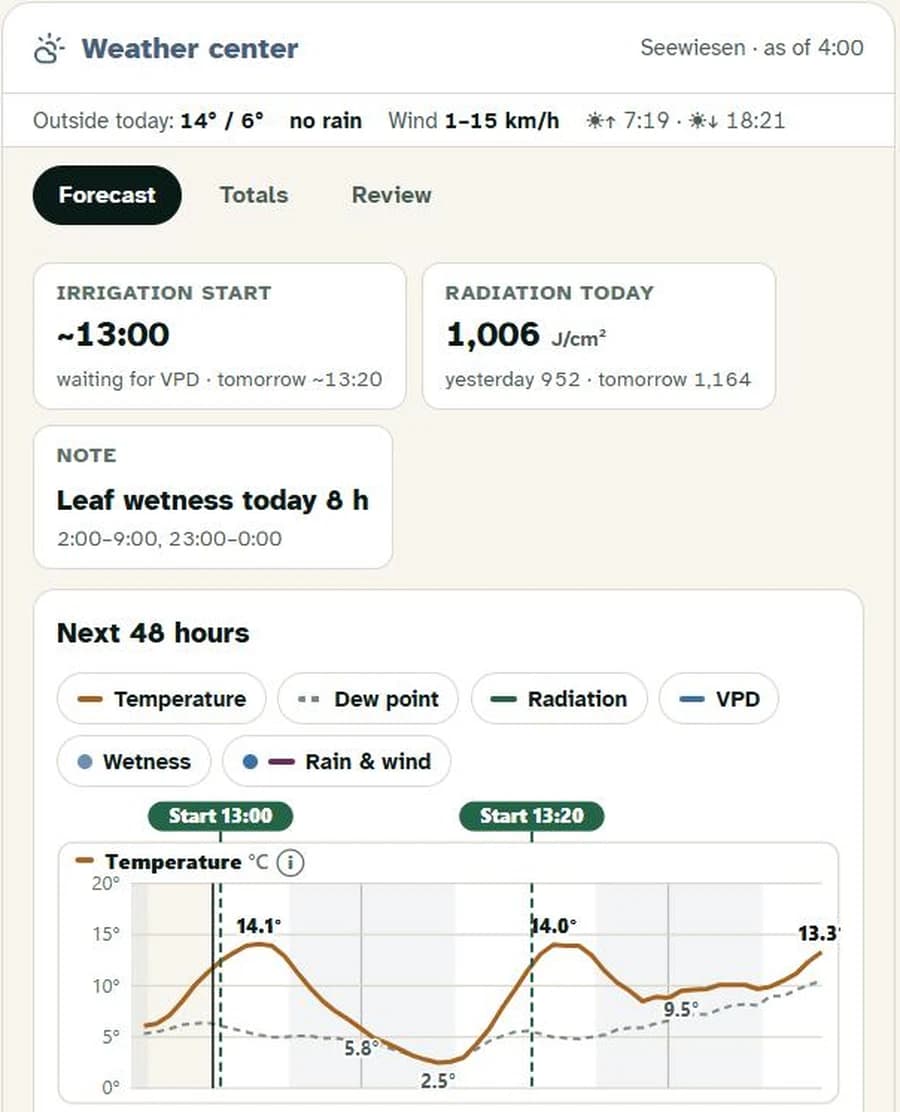
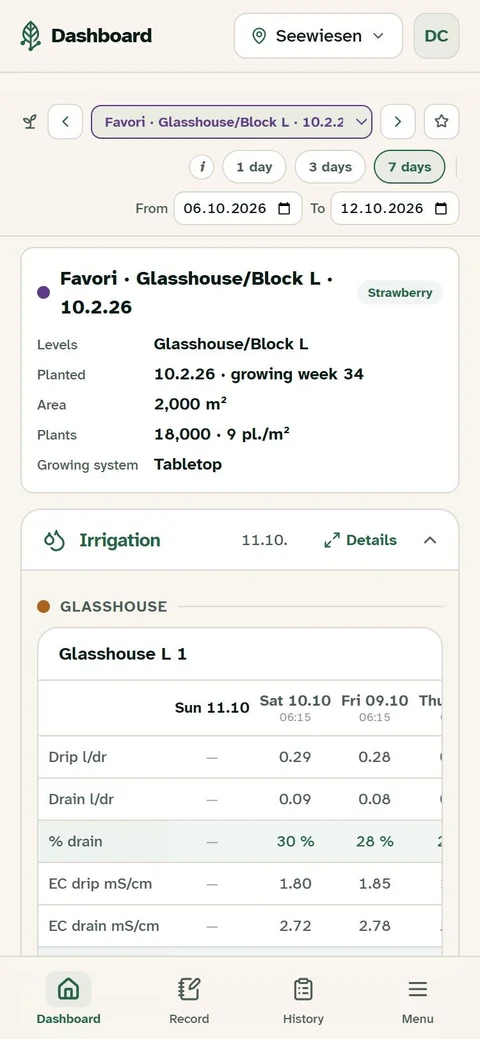
Weather · max. today14 °CGenchi · flowers per plant37.4 Tank A · level40 %Irrigation · % drain30 %CultiNode dashboard, crop FavoriExample values · demo farmFlowers / plant37.4 % drain30 %Tank A · level40 %Max. today14 °CCultiNode dashboard, crop Favori
Example values · demo farm
  • Recorded where you measureOn the phone in the tunnel, even without signal
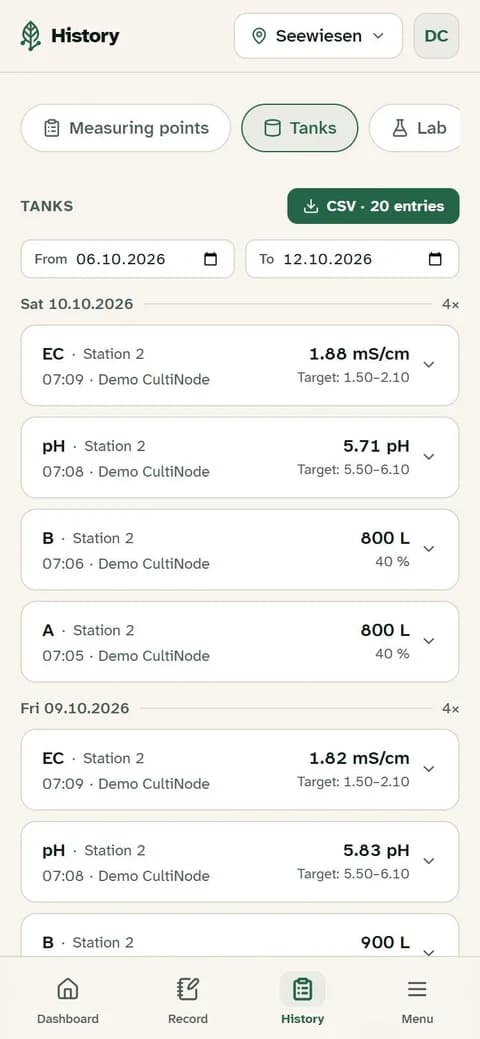
  • ComparableEvery value per crop and zone, over any period you pick
  • SharedYour team and your advisor see the same numbers
  • As you need itModules one by one. Nothing to install
Modules

What you already do, in one place

The basics first: the readings your team takes every day. Each one is a module, booked on its own.

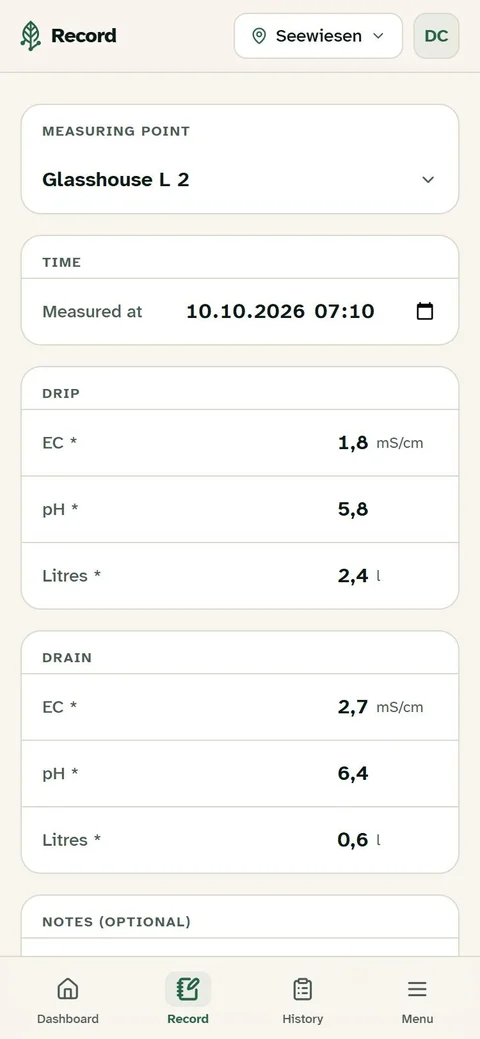
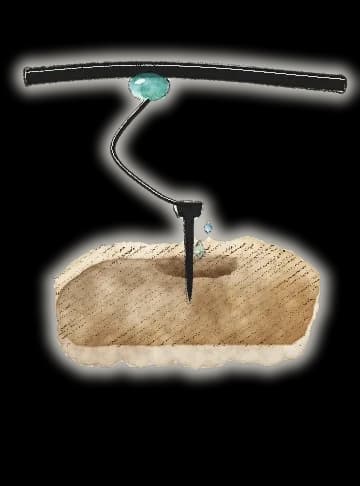
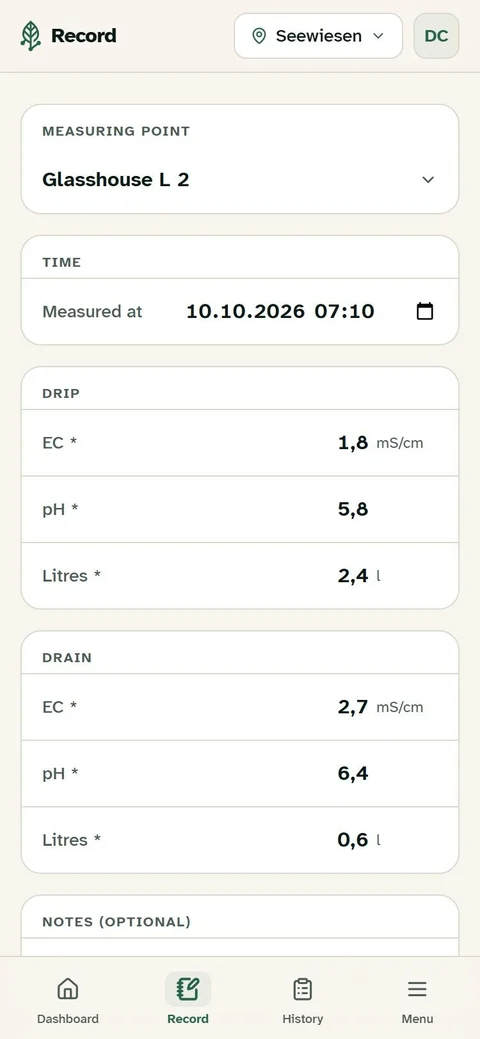
Drip and drain from the cups, EC and pH in and out. % drain is worked out for you. Large buttons, few steps, works without signal.

Record screen

Example values · demo farm

How it works

From node to number

A reading taken in the tunnel is on the dashboard before you are back in the office

  1. At the node

    At the measuring point

    Drip, drain, EC and pH, where they are measured.

  2. 1

    Record

    Large buttons, few steps. Seasonal staff manage it, even without signal.

  3. 2

    Compare

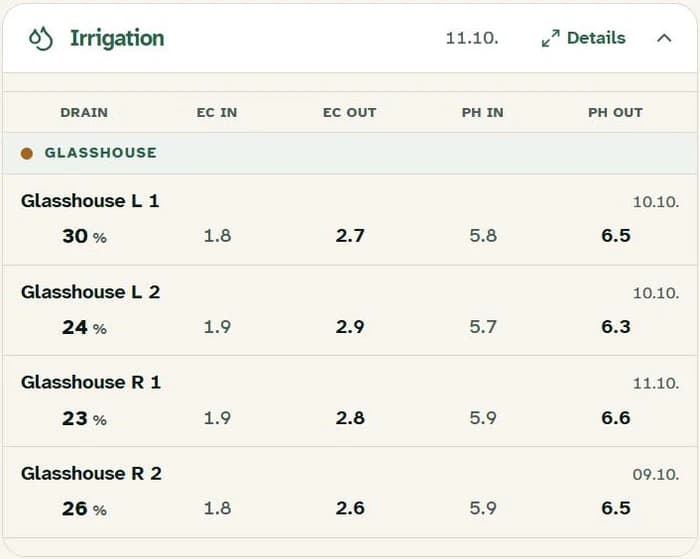
    Every value per crop and zone, day by day. You pick the period.

  4. 3

    Share

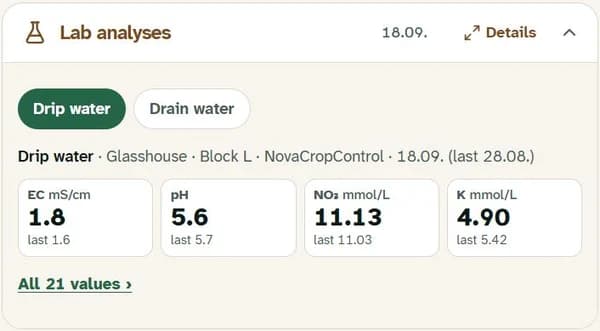
    Your advisor asks about EC, drain, the last lab analysis and thrips. You both look at the same view. What you agree on becomes a task for your team.

    Your data belongs to your company. You decide who sees it.

Example values · demo farm

Own metrics

Measure what your farm needs

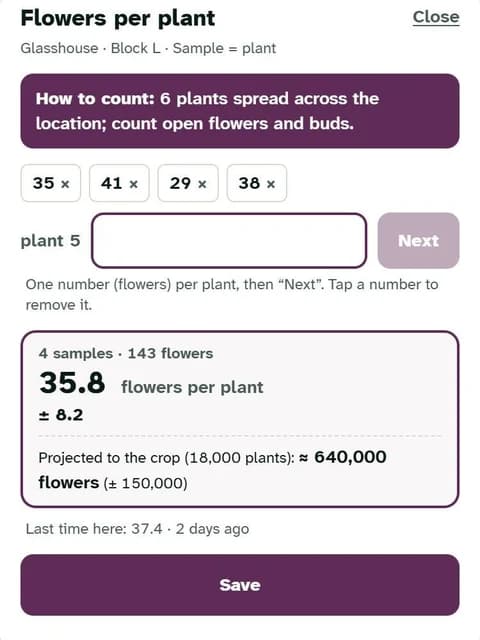
You decide what is counted or measured, and per what. CultiNode works out the average and, per plant or metre, projects it to the whole crop.

Berries

  • Flowers per plantaverage · projected
  • Canes per metreaverage · projected

Propagation

  • Losses per 66-cell trayshare in %
  • Runners per mother plantaverage

Vegetables under glass

  • Fruit set per trussaverage
  • Stem diameter per plantaverage in mm

A propagation nursery sees on the phone how high the losses per batch are right now, and how EC and pH develop in each field.

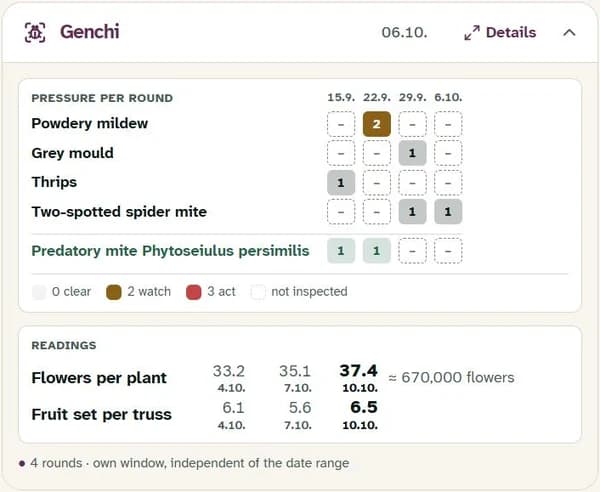
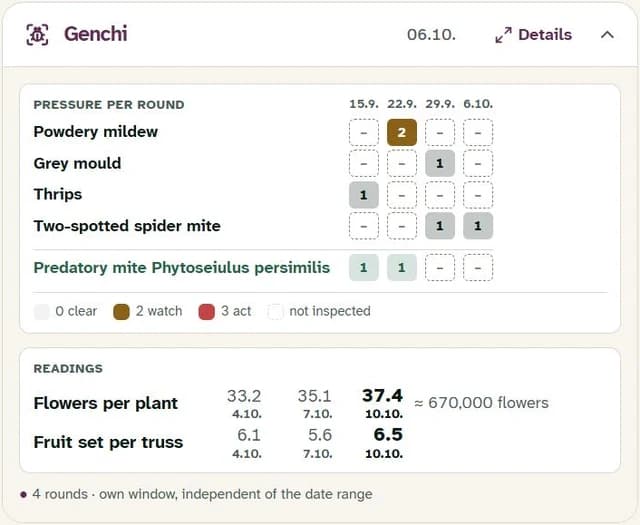
Crop card with pest pressure and own readings
Counting flowers per plant on the phone

Your counts next to pest pressure, on the same crop as irrigation, lab and weather · example values · demo farm

About

Built on a berry farm

Every morning, someone on your team walks through the crops. Drip, drain, EC, pH: the values go on a sheet of paper, then into a list, sometimes into a photo for the advisor. Everything is somewhere. Nothing is in one place.

That was our morning too. We grow strawberries and raspberries in Austria. I wanted one thing: the morning readings off paper and in my pocket, any time. So I built a small app for our own farm.

My advisor always says: get the basics right first, then come the details and new technology. That is what the app was for: drain, EC and pH in view, every day.

Talking with other growers and advisors, it grew into CultiNode: fertilizer recipes, tank levels, crop walks, lab analyses and weather. Today it runs every day on two berry farms. Next, we connect what your farm already has.

If this sounds like your morning, write to me.

Andreas Hoffelner info@cultinode.com